In learning to train a neural network classifying images, one often begins with tasks such as distinguishing between photos containing a cat, vs. a dog. This is a task any (visually able) human can accomplish with pretty much 100% accuracy.
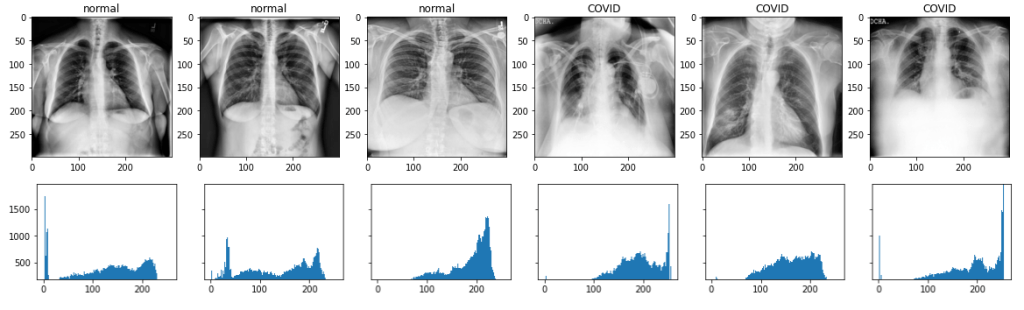
Now, though, I am working on a network that can distinguish between, for example, chest x-rays of healthy lungs vs. lungs infected by COVID-19. Looking at the original images, my untrained eye (as I am not a radiologist obviously) cannot tell which is which. I expected to see infected lungs to show cloudiness, but it was harder to discern that in the raw images.

However, after enhancing the contrast in the images and feeding them through a relatively simple convolutional neural network, I trained a model that can do so with approximately 96% accuracy.
Dataset and Preprocessing
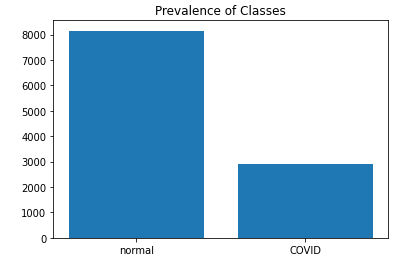
The dataset in use here is the “COVID-19 Radiography Database” published on Kaggle by Tawsifur Rahman and others[1]. It contains x-ray images under four classifications: “normal,” “COVID,” “viral Pneumonia,” and “lung_opacity.” Of these we will be using the first two. They contain 3616 COVID-19 and 10,192 normal cases. These are then separated into training, validation, and test sets (80%/10%/10%).
As separated, the images are also enhanced using Contrast Limited Adaptive Histogram Enhancement (CLAHE) to improve contrast in regions of the image, while maintaining consistent levels across the image as a whole.

The images are also scaled before fed to the CNN then to the range of [0, 1].
Convolutional Neural Network

As a first approach to the classification task, we implemented a fairly simple CNN using several convolutional layers to extract progressively complex features from the inputted images. Each convolutional layer is then followed by max pooling layer. Following those layers, the resultant representation is flattened (to a 1-dimensional tensor) and fed through a 20% dropout layer in order to prevent overfitting, randomly dropping some of the information. Finally, the output of the CNN is fed through a dense set of neural layers to classify the in out image as either showing COVID infection or lack thereof (“normal”), expressed as the probability of a positive case.
Given the relative imbalance of the normal vs. COVID infected cases, I implemented a custom weighted version of a binary crossentropy loss function. Crossentropy measures basically the difference or similarity of two (or more) distributions: the ground truth values and the predicted values in this case. The gradient of the loss is then calculated and applied to update the model’s parameters during each iteration of training.

Y is the ground truth labels, y hat denotes the predicted values, and epsilon is a tiny value (e.g., 1e-07) so as ensure that the input to the log function is always non-zero. Weights for each class are calculated simply as the frequency of the opposite examples, e.g., Wp= P(negative class) and vice versa. This is simply calculated by

Model Evaluation

On a whole this relatively simple model seems to be done fairly well, as can be seen in the confusion matrix above. Not only does it have an overall accuracy of approximately 96%, it has relatively few false positive and even fewer false negative examples than I expected given the relative class imbalance. Sensitivity and specificity is calculated to be 94.7% and 96.6% respectively.

Given the sensitivity (the true positive rate) and specificity (the true negative rate), I also calculate the positive predictive value (PPV) as the probability that, given a positive prediction, that the case is in fact positive. This is calculated according to Bayes’ Theorem. The “prevalence” (in Bayesian terminology the “prior”) is basically the percentage of positive cases in the dataset as a whole.

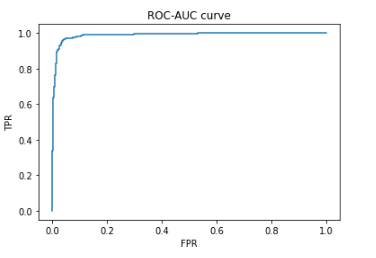
And finally the ROC-AUC curve is generated, plotting the proportions of true positive rate vs. the false positive rates at a range of thresholds. The AUC score (the area under the ROC curve) was calculated as .957.
All very well. In fact, one may wonder if too well given the relative simplicity of the model.
Class Activation Maps
In order to trying to determine what the model is “seeing” in order to classify a given image, we generate grad-cam saliency maps. Drawing from the weights assigned in the final convolutional layer, it will highlight those aspects of the image that had the most influence on the final classification. In the below example the activation map is visualized both as a heatmap and also as a contour map.
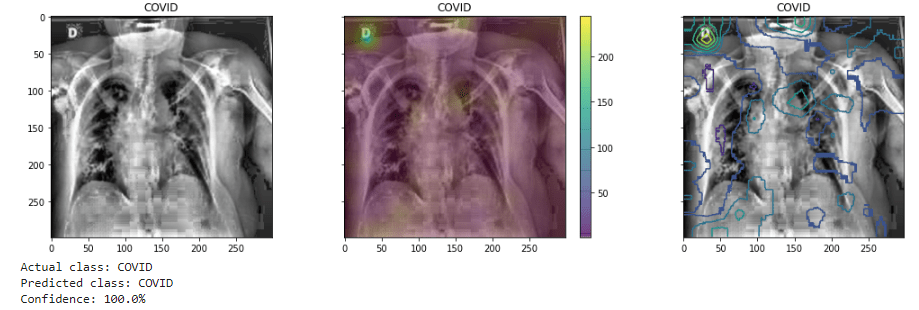
However, these are frequently inconclusive as to the focus on the lung region. In fact, it may show the model is “distracted,” in this case focusing on the annotation in the upper left corner of the image (the letter “D”). This issue has been noted by researchers[2], noting that the nature of the open datasets often used being “noisy.”
References
Project Github repository: https://github.com/karencfisher/COVID19.
The specific model referenced here is in this colab notebook: https://github.com/karencfisher/COVID19/blob/main/notebooks/covidradio_weighted_baseline.ipynb
[1] https://www.kaggle.com/tawsifurrahman/covid19-radiography-database
[2] Chun-Fu Yeh, Hsien-Tzu Cheng, Andy Wei, Hsin-Ming Chen, Po-Chen Kuo, Keng-Chi Liu, Mong-Chi Ko, Ray-Jade Chen, Po-Chang Lee, Jen-Hsiang Chuang, Chi-Mai Chen, Yi-Chang Chen, Wen-Jeng Lee, Ning Chien, Jo-Yu Chen, Yu-Sen Huang, Yu-Chien Chang, Yu-Cheng Huang, Nai-Kuan Chou, Kuan-Hua Chao, Yi-Chin Tu, Yeun-Chung Chang, Tyng-Luh Liu” A Cascaded Learning Strategy for Robust COVID-19 Pneumonia Chest X-Ray Screening,” https://arxiv.org/abs/2004.12786
M.E.H. Chowdhury, T. Rahman, A. Khandakar, R. Mazhar, M.A. Kadir, Z.B. Mahbub, K.R. Islam, M.S. Khan, A. Iqbal, N. Al-Emadi, M.B.I. Reaz, M. T. Islam, “Can AI help in screening Viral and COVID-19 pneumonia?” IEEE Access, Vol. 8, 2020, pp. 132665 – 132676. https://ieeexplore.ieee.org/document/914418
Rahman, T., Khandakar, A., Qiblawey, Y., Tahir, A., Kiranyaz, S., Kashem, S.B.A., Islam, M.T., Maadeed, S.A., Zughaier, S.M., Khan, M.S. and Chowdhury, M.E., 2020. “Exploring the Effect of Image Enhancement Techniques on COVID-19 Detection using Chest X-ray Images.” https://doi.org/10.1016/j.compbiomed.2021.104319

Pingback: Recognizing COVID-19 in Chest X-rays, part 2 | karen c fisher